Pipes saw some internal updates recently. It was fighting with some instability. My first measure was an internal re-architeture, on a small scale. Before, the data was transported as text from block to block. (Almost) Every block parsed the input, created an RSS feed object and then worked with that on the data, only to then output the created RSS feed as string. This was changed to just work with the RSS object directly and move that from block to block. That had some consequences for some existing pipes, mainly because it also changed when the input feeds gets normalized.
As that did not help, next step was a server upgrade. I'm not sure whether it was directly the additional processing capacity or the dependency upgrades, but that one helped so far. Knock on wood. Also reconfigured the amount of threads and puma workers, that might have solved a bottleneck somewhere. I sadly never pinpointed exactly what made the server process stop before.
I had played with a proper split between web frontend and pipes processing, but at least my approach was not viable. Worked nicely while developing it, immediately crashed with the production workload. And Pipes is not all that huge... I'll have to try again some time.
Pipes does have some building blocks to prepare that operation or work with the result, there is an extract block and an insert block (that works by xpath). But I was always missing a model for the request block that I remember from Yahoo Pipes, that's why there is only a feed and a generic download block so far. Post somewhere, replace the item (or the item's content?) with the answer, that might be it.
Edit: Thinking a bit more about this, don't forget that you can already chain pipes. A service you can POST to can probably also consume an RSS feed, download it by itself. You can then have one pipe that creates the feed up to the point where you would want to have it be treated by something else, let that thing output its result, and in a second pipe download the output and create the final feed. I still think the request block to POST items is a good idea, and there are probably services that can't store the output for the second pipe as they'd just react directly to a POST, but that chainability might be worth to keep in mind.
We had the same question, so we went and talked with a lot of the original team and wrote up the story[0]. We also made a fun mini-site that contains a lot of easter eggs (e.g. if you click on the "Memory Pipes" folder on the desktop, you'll see a bunch of candid photos of the original team circa 2007)
Everything is so flat and boring now...
The architecture and software behind Pipes - https://news.ycombinator.com/item?id=22959013 - April 2020 (12 comments)
Show HN: Early-stage Yahoo Pipes spiritual successor - https://news.ycombinator.com/item?id=14440993 - May 2017 (126 comments)
And NodeRED is big in the home automation space: https://nodered.org
Nothing in the system says "AI" to me, and I've self-hosted one for a while now
I can't grok the Home Assistant UI for creating any kind of complex automations (and I've been writing software for a living for 25 years), but NodeRED works perfectly for complex branching operations.
From what I have seen, these kind of frameworks facilitates the worst possible combination of factors: A solution designed, created and implemented by non-programmers, not using a programming language ending up in a production environment.
One could argue this is a success in its own but I have only seen these kind of things hit their limits almost immediately after the initial POC and evolve into terrible tech debt. Just learn to program or script already.
That being said, I do not want to disrespect the effort into building this and perhaps there is a place for these kind of solutions I yet have to experience.
The operations Pipes can do are at the same time very generic and very targeted. It's stuff like "Download this url" and "Filter this feed for that word", and it gives you a selection of blocks like extract and insert with which you can manipulate the data in the pipe (or the feed, depending how you look at it) a bit more freely. There is surprisingly a lot that can be done with that, especially with a replace block that supports regex, but it's not a deep abstraction layer above things that are not mappable to rather small operations.
If I had to do it all again in 2024, what’s a robust self hosted project like this?
But after thinking about it, it feels natural, because usually we talk about "Things" and the "Connections" between them.
Could be a companies org chart, a family tree, a network diagram, abstract things like processes. It's all "Things" and "Connections".
Maybe that's why graph theory has so many applications. Because at the end, it's all just graphs with vertices and edges.
That's not the end. At the end there are just objects and morphisms between them. Graphs (with their edges and vertices) are just a special category of... Well, have a look at "Category Theory".
Code is downstream of thinking, which makes it downstream of lines and boxed.
Visual programming with say boxes and lines at its core should not involve an ast.
You need to think outside the box. Your thinking of textual programming as the core and the visual programming as an abstraction above it which is how the industry has been focused since its inception.
https://en.wikipedia.org/wiki/Nassi%E2%80%93Shneiderman_diag...
Some visual programming languages use lines to represent control flow, others use them to represent data flow, and others use a mixture of both. Additionally, different kinds of control and data flow can operate at different frequencies within the same system.
Snap!, which is essentially a visual block based version of Scheme, allows you to pass functions or closures, by wrapping blocks in gray insulating "gaskets" like lambda expressions that delay evaluation, and even supports macros, special forms, continuations, user defined control structures, and threading, just like Scheme.
Another example is Max/MSP, which primarily uses lines to represent control flow and data flow. However, it also distinguishes between data flow at "simulation tick frequency" and a much higher "signal processing frequency". This means thousands of audio samples can flow along one line at every simulation tick, while only a single piece of data or signal (like a pure data-less control flow "bang") may flow along other lines at a slower simulation tick frequency.
https://en.wikipedia.org/wiki/Max_(software)
In data flow visual programming languages, a data flow box can emit any number of data outputs at once in parallel.
A control flow box typically emits only one control flow output at a time, unless it acts like a "fork" operator. Fork operators, as seen in Petri nets, support concurrent processes by allowing multiple control flow outputs.
https://en.wikipedia.org/wiki/Petri_net
A data flow conditional works like a relay with three inputs (A, B, and Select) and one output. The Select input determines whether A or B is the output.
A control flow conditional, like a traditional flowchart "if", has one or more control flow inputs, a Select data input or embedded expression, and multiple control flow outputs. The Select input or expression chooses which control flow output the "program counter" branches to next.
Pure data flow networks do not have a single explicit "program counter." Instead, they typically evaluate nodes in partial dependency order, which may include loops (introducing a one-cycle feedback delay). Petri nets have multiple concurrent control flow "tokens" that flow between boxes along the lines in parallel.
Another example is Body Electric aka Bounce, which is a data flow visual programming system with relay-like data flow conditionals, but also each box has an implicit "enable" input that you can use to switch it on and off (like a power supply), so when it's turned off, the last calculated outputs are latched and buffered, and can be read by downstream dependencies, but the values are not recalculated during simulation frames when it's not enabled.
https://donhopkins.medium.com/bounce-stuff-8310551a96e3
In Blender geometry nodes, data flows from left to right, while functions can be passed and applied in a way that evaluates right to left against the data flow. That is, functions are passed on the left, but the data is then processed through the function, either once or iteratively.
https://docs.blender.org/manual/en/latest/modeling/geometry_...
New Blender 4.0 Loops!
https://www.youtube.com/watch?v=mr_nQBoJPXw
Functions or operations can be encapsulated within nodes and passed along the data flow. For example, a "Subdivide" node contains a function to subdivide geometry, and this function is applied to the geometry data passed into the node.
Nodes can pass functions as parameters to other nodes. For example, a "Function Input" node can be used to define a custom function that can be passed into another node, such as a "Map Range" node, which applies the function to its input data.
Functions are applied to the data as it flows through the nodes. For example, a "Set Position" node can apply a function that modifies vertex positions based on certain criteria (e.g., noise texture values).
Some nodes, like "Attribute Math" or "Attribute Vector Math," apply mathematical operations to attributes of the geometry, effectively using these operations as functions that transform the data.
Nodes can be configured to apply functions iteratively or conditionally. For example, a "Repeat" node can apply a function multiple times to achieve iterative processing, such as repeated subdivision or transformation.
Conditional nodes, like "Switch" or "Boolean Math," allow functions to be applied based on specific conditions, enabling selective processing of data based on attributes or other criteria.
While data flows left to right, some nodes can evaluate data in a right-to-left manner when applying functions. For instance, a "Function Output" node can send data back up through connected nodes for additional processing before final output.
This evaluation allows for more complex operations where data may need to be processed in multiple stages or cycles.
But this "other" form on first glance can look very different. There are no boxes and lines in C++ or python for example.
You’re saying c++ and python fit into a category of programs that is foundation-ally really just boxes and lines.
I’m saying that’s not the right way to look at it. Because you can make the opposing statement. You can say that programs that are boxes and lines are foundation-ally just text programs.
So because both contradictory statements can be made both aren’t really correct. There is no hierarchy. Boxes and lines is one concept and textual programming is another peer concept standing on equal footing. Both are isomorphic and thus translatable to each other.
The point of my post is to suggest that there are other concepts that occupy this equivalency space. Imagine a category of interchangeable interpretations of programming that are all translate-able between each other with no hierarchy. It’s similar to the space of human languages. All human languages don’t occupy a hierarchy yet all are isomorphic.
But you're right that there are other ways. Scratch is an example. But most programming languages are relatively close to math notation, and that appears to be convenient for us.
If you want to see a programming language that works entirely differently, yet still has a graphical representation alternative in boxes and lines, look at CSound. It's an (old) language for generating sound, but its representation is different.
I think most programmers find this logic easier to type out than to "draw" in a graph, but it's conceptually the same thing.
The main point of my post is to suggest that there are other equivalent concepts between text and box/line.
To note, most text is a symbolic representation of spoken words and words are abstractions of any number of things. Both physical things such as "running" and less physical things such as "thinking." (Yes, legographic texts exist, such that they may not be representing spoken words, but I fail to see how that changes things here?)
Mainly because it's the most straightforward method to:
1) Visualize a contained piece of code / function (box)
2) Show where the output of X goes to (line)
There may be other styles, but this style is the easiest for a newbie to wrap their head around, and is the cleanest method of visualization. The box method can then be used to further wrap a bunch of boxes into a larger box when needed.
https://successfulsoftware.net/2024/01/16/visual-vs-text-bas...
But Snap! goes way beyond Scratch, since it was inspired by and visually similar to Scratch, but is just as powerful as Scheme, including functions and everything else as first class objects, lexical closures, continuations, user defined blocks, macros, special forms, etc. It's much more powerful than Scratch, but uses the same visual interlocking block syntax.
Snap!:
Scratch:
Squeak eToys:
Blockly:
https://developers.google.com/blockly
Also, spreadsheets are an extremely popular form of visual programming that has been around for a long time, which don't use lines to connect boxes either.
VisiCalc:
https://en.wikipedia.org/wiki/VisiCalc
Lotus 1-2-3:
https://en.wikipedia.org/wiki/Lotus_1-2-3
Microsoft Excel:
https://en.wikipedia.org/wiki/Microsoft_Excel
Brad Myers' paper answers the age-old argument about whether or not spreadsheets are visual programming languages:
Seems like a space that could really use some innovation
Then you could use the arrow as a progress bar, and you'd have something that's a bit more focused on the inputs and outputs.
Also, the data types could show up as a stack of boxes (like a deck of cards) so you can see when you've calculated a novel dataset (highlight new card on top the deck) or when you've recalculated a previous dataset (highlight the nth card).
Such a view would resemble a commutative diagram (from category theory) and if you let the cards pile up for a while you could use their sizes to reason about which functions are bijective, which are good candidates for memorization, etc.
When you want to know why a certain datum is the way it is, you can use the same view to trace it back to it's inputs (in the boxes-as-tasks mode, you end up zooming in on some imperative artifact... logs usually... And discerning the inputs is left as an exercise to the reader). I think this goes by the buzzword "data lineage" and it's usually this extra thing but I think it should be the main thing. Which is why I want to make the nodes into edges and the edges into nodes.
How do you visually identify a function with multiple inputs and outputs? I tend to imagine it as a bi-graph - with boxes for values and for functions, and arrows in between. The stack idea is interesting and can work here too.
I could get behind saying "all functions have exactly one input value and one output value" but you really need to be able to construct and deconstruct structs/records/tuples to be able to e.g. pass two values to one function.
The structs/records/tuples approach would work (I think this would correspond with "currying"), but I have this weird idea that certain types of reasoning have a "shape" and that we might be able to more heavily lean on analagous reasoning if we could easily show that shape in correspondence with explanations of our reasoning. I worry that currying everything would force us further away from the "natural" shape (if there even is such a thing).
I've been working on something called plibs (simPlical mad LIBS, since really we're showing a https://en.m.wikipedia.org/wiki/Simplicial_complex here). The functions are represented as tuples of the same arity, and described via sentences with blanks in them (e.g. when you run ____ code in ____ environment you get ____ from stdout). One with three blanks would then appear like a triangle and then I'd fill it in with a gradient indicating which sides are inputs and which are outputs. Functions sharing a mad lib would appear as a regular polygon in the same color (one edge for each blank). Or maybe they're sort of starfish shaped so that each leg can reach out an touch whatever the data representation ends up being.
One could imagine algorithms that generate patchwork quilts or 3D structures (like how protein folding is represented) out of such things. These could be computed only in one direction (from inputs towards outputs) but they could be traversed in any direction if one wanted to explore the relationships.
I'm hoping it will be a nice way of citing your computational sources. You would attach them to any computational result (alongside a scientific paper, perhaps) as a way if saying "here's how I came up with this, rerun it to verify my result". Aside from the computational pathway that yielded the result that's being scrutinized, you could explore adjacent plibs to understand why certain inputs were chosen or to gain other contextual hints.
Now that I'm describing it it sounds a bit like that awful zooming-through-towers-of-data visualization in "Hackers" the movie.
So the "edge" that I was using as a progress bar in my previous description is really a series of paths through a space made of these things. The details of the functions being called (and of the datasets being generated) are attached to the polygonal regions that the paths connect. The paths may merge or branch. It could get unwieldy, so the user would have to be explicit about which plibs to show and which to highlight as a chain of computation.
As for how the represent the intermediate data and their types, I keep changing my mind. Some days I like the stacks of cards thing, some days not. Hopefully something will sick soon, then I'll try to build it.
Wow that’s a pretty wild idea. Quite interesting.
I’m not sure what to consider “natural”. I know category theory (I’m a physicist by training, not CS, so I’m not talking Haskell or whatnot) tells us that these 2D drawings of computation graphs have a well-defined meaning (eg you can deform the lines continuously and it doesn’t change the result, etc). In particular, we have these monoidal categories where we can e.g. draw two lines in parallel to represent two pieces of data flowing.
The thing is the “monoid” can either by the product (two values in a struct, say) or a sum (two possible values in a variant) and you get the same “rules” for how to draw it. Back when I was drawing tensor network diagrams it would really tricky to include both monoids on the one diagram. You could kinda do it in 3D but that’s not natural or easy. What people do in practice (in flowcharts, etc) is we tend to have these AND and OR junctions (and their inverses) where a human can kinda infer what’s going on (e.g. does this split and join refer to two parallel computations or branching logic?).
I think both monoids are critical to expressing computation and I still don’t know what the “natural” yet “rigorous” way to draw these things is.
We really have only two styles of visual programming:
1. Some sort language formed by left to right based alphabetic symbols in some pattern called "grammar". There's an almost infinite amount of possible grammars
2. Boxes and lines. Where boxes represent state or function and lines connect the boxes and state together. There's less formalization in this area so the axioms are vague but it can form something of a "grammar" similar to the above.
That's it. It's not a space that could really use innovation. It's the fact that the entire space has never innovated. We've just been drilling down on a very specific and biased way of seeing the universe. The concept of a compiler literally illustrates how deep it goes and how tied the idea of a program is to a "language".
You forgot about block based visual programming languages like Scratch, Snap!, and Nassi-Shneiderman diagrams, and also the most ubiquitous, widely used, universally known, commonly taught, extremely powerful, and easily accessible style of visual programming language, which the worldwide economy depends on and would collapse if millions of people didn't regularly use them every day: spreadsheets.
What about ERD? If you materialise that into schema, is that programming?
I think you'll run only into those two categories - boxes represent literal code you join together, or boxes represent something declarative that gets compiled into code but not necessarily in a straightforward way.
I guess visual reporting like in MS Access could be thought of as a separate category?
Depending on whether prose is programming, there's also https://visar.app/
And then there's CUBE https://marc.najork.org/papers/vl1992.pdf
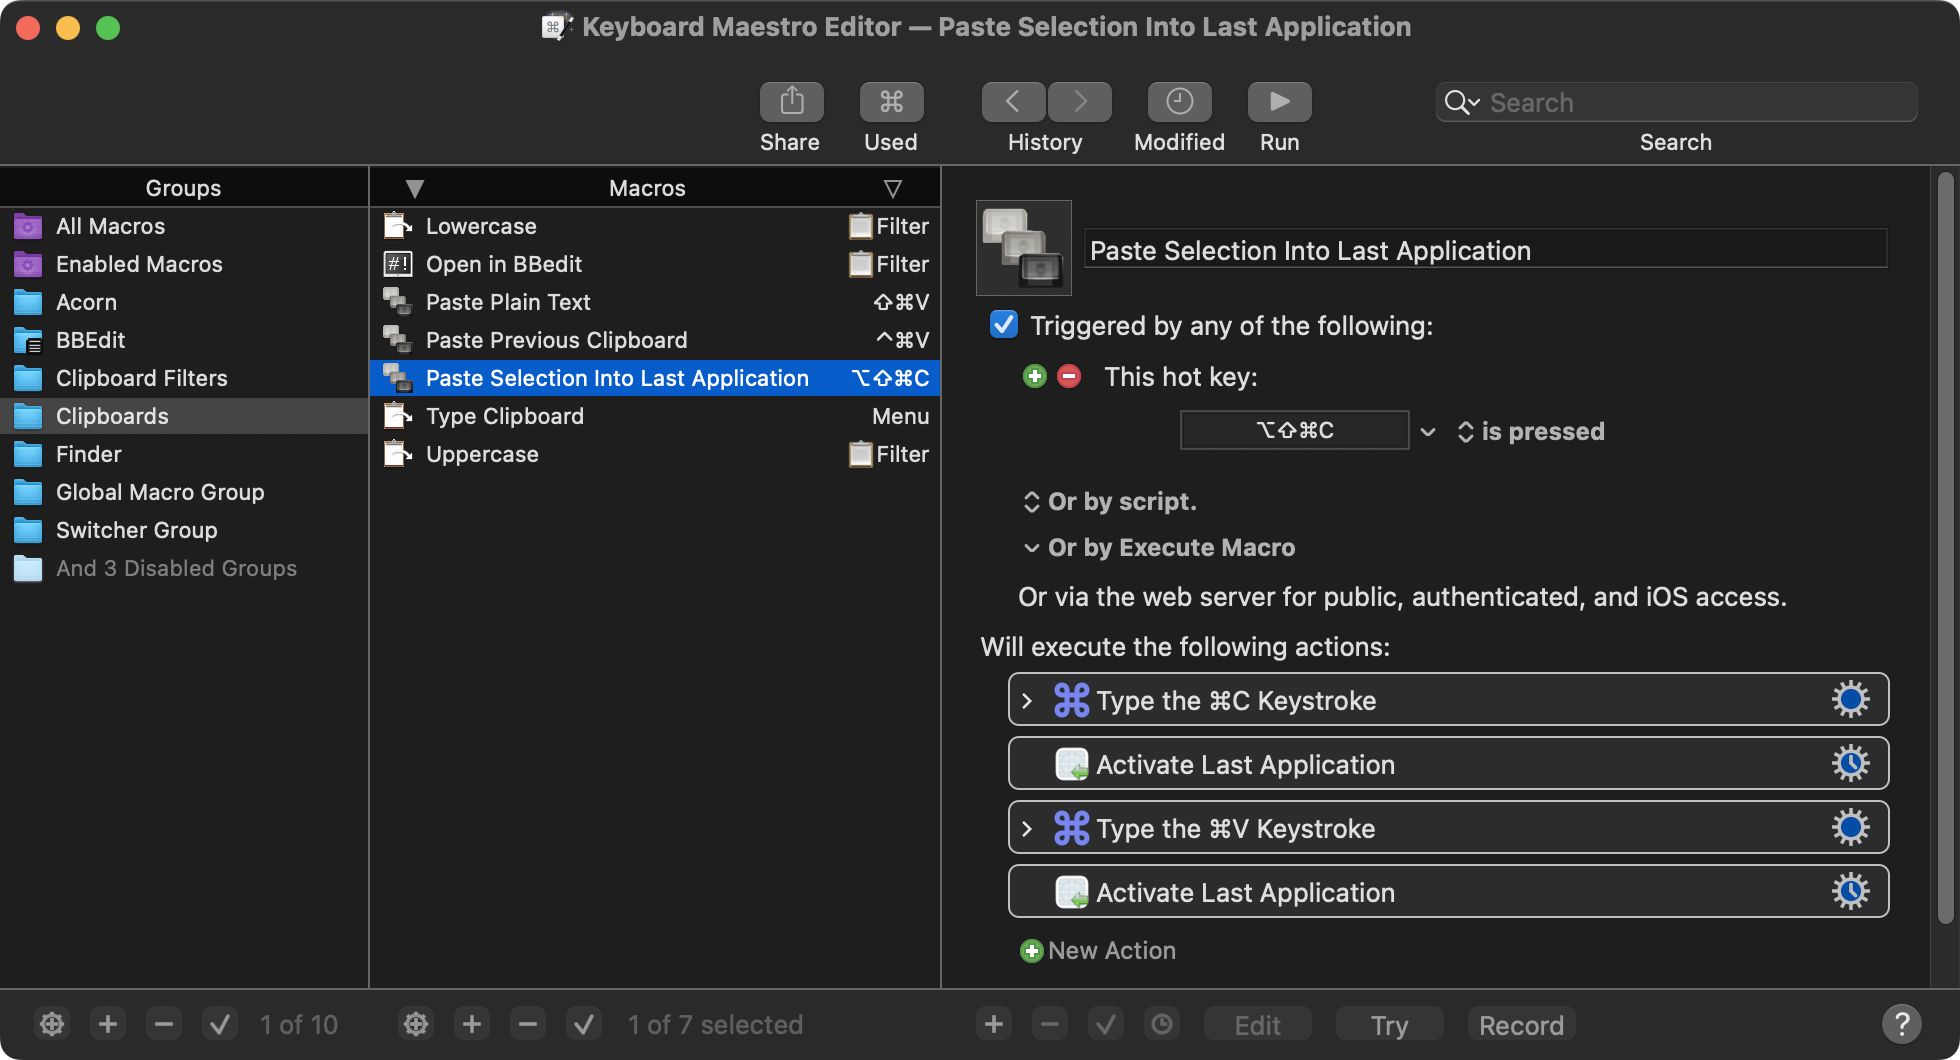
https://www.keyboardmaestro.com/img/v11/overview-dark@2x.png
(although [per Wikipedia] the first Scratch prototype does seem to predate Automator by 1.5 years, so I suppose it’s possible there’s a connection)
[1] https://folklore.org/A_Rich_Neighbor_Named_Xerox.html [2] https://en.wikipedia.org/wiki/AgentSheets
I need to fix the docs because they are dead: https://web.archive.org/web/20200819221527/https://docs.refi...
Yahoo Pipes was an inspiration though. It was similar to Heroku in many ways.
Do people still use RSS feeds?
I work on a similar product[0], conceptually at least, to Pipes, and many of our users have asked for RSS feeds as output.
Until now I’ve rationalized that as low priority, but maybe I’m wrong?
If your users are asking for it then it's locally popular regardless of how much use it gets on the general internet, and therefore it should be important to you. Local popularity (eg the market for your app) is significantly more important to product design than general popularity.
It's not a complicated thing to get setup! There's a bunch of details you can flub but at the end of the day it's a big thing of markup. The "good enough" thing is easy.
Another data point from me: I recently started unsubscribing from as many newsletters as possible, and have organized them into hierarchical tree structures in my RSS feed reader instead, according to priority and topics. With many hundred sources by now, some of them extremely prolific posters, I rarely make it past the top priority ones, but for the rest, there is the occasional browse, and a full-text search that I can use on specific topics.
This setup allows me to consume newsletters and blogposts much more efficiently, and the mailbox gets mainly used for correspondence, not general stuff. Suits me just fine, and as an added bonus: I now more seldom have the feeling my every move-move is monitored and stored by who knows who, who knows where, for who knows what purpose.
> move-move
= mouse-move
Or you just send your users to Pipes, they could use a download and "build feed" block to create a feed on their own ;)
Edit: Though I noticed that the endpoint of your loops can be specific actions, like a text message, that wouldn't translate of course. More a "put it into the feed" target action then.
It’s not perfect and has a display limit of 50 for a feed’s most recent items, and you can’t sort feeds (unless you pay). But it works well enough. What’s nice is that it actually renders YT links in the reader, with the option to view them in “reader mode”, which conveniently prevents ads from showing.
Daily. For me RSS feed is the only option to pick what I want to read instead of reading what promoter wants me to read.
If there are other ways - I would be happy to know.
If anyone is interested in a more generic visual-programming language, check out Flyde - https://www.flyde.dev - an open-source visual-programming language I'm working on
My vague memory of how this ended last time was processing cost and lack of a business model.
[0]: https://github.com/shouya/rss-funnel
disclaimer: rss-funnel is my own project.
Unix pipes are alive and well, or are they also an association with a dead product?