Graphviz is a visualization framework and it includes many layout engines, implementing different algorithms: dot, neato, fdp, sfdp, circo, twopi, ...
It would be great if this new custom algorithm were to be contributed to Graphviz.
[1] https://graphviz.org/doc/info/lang.html [2] https://graphviz.org/docs/layouts/dot/
Not sure why they can't come up with new names, use those, then when you invoke the program in the terminal, call the binary the same thing, instead of mucking about with calling everything differently, except some things, that share names.
This is exactly what they have done. You can call "dot" and it runs the dot layout engine, but you can also run "neato", "sfdp" or any other -- with the same input.
The "graphviz" package installs all these executables.
It’s not the language name for all Graphviz syntax; it’s only the syntax for renderings made with the dot engine. Each engine has its own DSL, basically.
Does it? There are slightly different DSLs for directed and non-directed graphs, some features only work with some output formats, but AFAIK, everything in the DSL in independent of the layout engine.
layout = neato;
(See https://graphviz.org/docs/attrs/layout/)
And if I look in my /usr/bin, I see that neato is just symlinked to dot. It's pulling the usual trick of one executable that behaves slightly differently depending on the invocation name.
The specific engine syntaxes are by & large mutually incompatible, but DOT does seem to be the label used for the overall lang as well as the dot-engine-compatible dialect.
The documentation includes a big table of attributes that graphviz tools recognize.
With the availability of LLMs, there is better automated support now to find features that are needed. Just imagining here, but "make the layout fill the available space" or "make all the nodes look like points with associated text labels" (not sure if that even works but it should).
I used to use the dcc application Nuke and it had some very complex graphs but the different nodes were all color coded so zooming out you could get a good idea of what was happening where just from the average color of a section.
It didn’t have an auto layout algo as good as this though.
Definitely true that application-specific design is often not worth the investment though. Chasing that 1000x improvement can easily cost you a year or two.
Usually there is a good middle ground: heuristic analysis of the input to see if it fits well with special-case "stupid and fast" algorithms, and sophisticated optimizations that are the fallback and work for everything and come with guarantees.
Also judging from the final two images (dot vs iongraph for the same large graph) it’s clear that dot is optimized for minimal area where iongraph does not. That’s the trade off. The author claims one is more easy to navigate than the other, I think that’s debatable.
Ultimately I found that visualizing large graphs is rarely helpful in practice; they can certainly look nice for some well defined graphs, but I rarely saw well defined graphs in the wild. Ymmv but maybe some would agree?
Fundamentally, the problem is that visual aids can only really represent a few dozen things before they become as complicated as the thing you were trying to understand in the first place.
And when analyzing messy node diagrams, it’s not just the nodes we’re trying to visualize, but the lines connecting the nodes (the “edges”). We can only visualize a few dozen of those, and that typically means we can visualize only a handful of nodes at a time.
Visualization only works in trivial examples where you don’t need it; it fails in complex environments where you need it the most.
I mostly agree with you dfabulich - the repeated efforts to create node/pipeline tools "visual programming languages" are not built for us, and feel redundant.
But I took issue with "where you don't need it" as this is very much dependent on who "you" is.
To be clear, what I think makes the latter graph more readable is particularly that the wires are easier to follow. Yes, it’s subjective, but backed up by my own personal experience. Long term I think we can add more interactive features to help us in such cases, e.g. search and dimming irrelevant wires.
Yes, I'm with you: https://jerf.org/iri/post/2025/on_layers_and_boxes_and_lines...
Since writing that I'm finding my frustration at the inability of diagrams to link out or be linked into is growing. In hindsight it seems a super obvious way of using diagrams in a useful manner and nothing supports it worth a crap, even things that really ought to like Mermaid (which permits out links in text but holds it at arm's length (requiring you to set the diagram to "unsafe"[1]) and as near I can tell in a quick search never mentions this as a thing you can do in its docs, and still has no particular support I can find for linking in to a graph). This has turned into a "can't unsee" for me.
(Obviously I have not used every diagramming solution ever, so maybe there is something out there that supports linking in and/or out, and I'd love to hear about it... however, bear in mind I'm looking for what you might call "first class" support, that is, a feature clearly considered important in the design phase of the project, not the sort of accidental-combination-of-features accidental support that Mermaid half has, if you flip some obscure settings to "lower security" somewhere.)
[1]: https://stackoverflow.com/questions/41960529/how-to-add-a-li...
the point of a boxes-and-lines diagram is to express relationships between components at a single layer/level of abstraction
the best metric for the "quality" of a diagram isn't the number of boxes, rather it's the number of edge-crossings, where >0 is a pretty reliable signal that either (a) the diagram is trying to show too much, or (b) the architecture is sub-optimal
any non-trivial system will always require multiple boxes-and-lines diagrams to be accurately described, one per abstraction-layer
and not really sure that linking between diagram and code is a core requirement, diagrams will generally include identifiers that are unambiguously grep-able, i guess...
I wonder if any of these techniques turn up in whatever the magic sauce is in D2’s TALA layout engine, which is in a league of its own IMO.
Dot is such a simple and readable format (particularly if using the basic features). Thus, it can make a ton of sense to define graphs in strict dot, even if you will be rendering with another tool than Graphviz.
These days, there are other popular options, too -- Mermaid, etc, as TFA indicates. Nonetheless, Graphviz/dot will remain for the long haul, IMO, because dot is so, so good.
So, you need Graphviz for its syntax definitions primarily, and because it is a standard that could be recognized/run anywhere.
[1] https://www.cs.ubc.ca/~will/536E/
[2] https://github.com/ogdf/ogdf/pulls?q=is%3Apr%20author%3Adllu...
I have struggled with code to diagram tools for a while [mermaid and graphviz], and usually return to figjam when I need the readabilty and aesthetics.
graph-viz is MASSIVE and a binary. mermaid requires the browser's svg rendering system to work. I just need something that builds diagrams from description easily ...
I used graphviz to generate graphs for code structures, and that worked out great.
https://niravko.com/blog/visualize-cpp-data-structures#resul...
I succeeded to use resvg-js [1] with dagre/graphlib [2] to render graphs. resvg-js uses a 4 MB node library to render SVGs. dagre is used by mermaid for graph layout (for some of the diagram types). if you disable loading system fonts in resvg-js it just takes milliseconds to render the SVG.
I know that mermaid is well-known and very useful, but I don't like the code quality (especially consistency) and the bloat of dependencies. Last time I went through the code I assessed it requires significant refactorings to make it work with resvg-js, i.e. server-side graph layout and rendering.
There is also nomnoml [1], which is so great, it should deserve at least the same amount of attention as mermaid. the nomnoml codebase is a joy to read. the author even converted the dagre/graphlib codebase to typescript [4].
[1] https://github.com/thx/resvg-js [2] https://github.com/dagrejs/dagre [3] https://github.com/skanaar/nomnoml [4] https://github.com/skanaar/graphre
---
Edit: One of the refactorings to make mermaid work with resvg-js is related to measuring svg text width. It's needed to determine the width of the graph node boxes. mermaid needs to be able to also use `resvg.getBBox()` to make it work with server-side rendering.
If you want something that builds diagrams from textual descriptions, you might want to check out TikZ, which includes a subset of graphviz but also lets you draw anything you want. See https://en.wikipedia.org/wiki/PGF/TikZ. On the other hand, you won't have the rapid visual feedback you get with WYSIWYG drawing editors like FigJam.
https://marketplace.visualstudio.com/items?itemName=infragra...
i.e. having a general purpose diagram/graph layout is hellishly difficult, but most of the diagrams/charts follow much simpler rules, thus it's much easier to have N languages, each for 1 type of diagram, than 1 language for N types of diagrams.
I highly encourage people working in this space to revisit those lessons.
Obviously if you find a new way to work around the limitations please run with it.
But limited scope, and targeted simplifications is the only way I have found, over application by trying to describe everything almost always ends up being more harmful in my experience.
I already implemented (in other prototype) diagram for event calculus (i.e. consideration of event stream through addition of new events like rollback, modify etc.)
On paper I have designs for point-in-time designs, scenario divergence and also some fun ones like a bingo card template. Diagrams are one thing, but there's also a design for collaboration and play-replay capabilities.
That being said, that's only a design right now with a simple prototype on the website :)
(it's a joke! and the joke is that those are two different general purpose. but still.)
Language developers really do struggle with debugging our data-structures since they are often both circular and complex compared to many other applications, I wrote yet-another-UI tool for inspecting code back when I was doing my thesis work.
Maybe I should brush it off (and make it general... ), it would give you a source-code view and navigating the source-text you would be shown compiler nodes related to the lines/statements.
It was almost the only way to make sense of it since I was often generating multiple paths per statement (It was a lossy type-inference system so previous type branchings could lead to multiple subsequent code-paths through each statement and expression).
Having used Graphviz for fairly complex visualizations I was initially shocked that someone would rewrite it themselves. Then I saw the breakdown of the algorithm and realized it may not be as complicated as I first thought.
All that being said, as a general rule it is hard to know what the hidden complexities may be until you are finished implementing the algorithm.
it also seems to conflate how a DAG is expressed, with how that expression is rendered
strange
I was intrigued, but couldn't make it work reliably. Perhaps I forgot to add "make it look nice" to my prompts.
https://arxiv.org/abs/2412.04237v3
https://github.com/microsoft/LayoutGeneration/blob/main/Layo...
There is no single layout definition that looks good for all applications. What looks good for one type of graph data (flow charts, org charts, ASTs, family trees, etc, etc) may not look good for another.
Once you've reduced a desired type of layout to a set of layout rules, then I don't think implementing it is the bottleneck, and it seems this part could even be automated if wanted (e.g. evolve layout to best meet constraints).
One small improvement they could probably make is the ability to rearrange outputs at the bottom to reduce crossings. Just from the very first example it seems flipping the 0 and 1 outputs on the bottom graph would be nicer.
For anyone else interested in this general area, Steve Ruiz and Lu Wilson from tldraw often tweet a lot of fun nitty gritty edge cases in graph drawing.
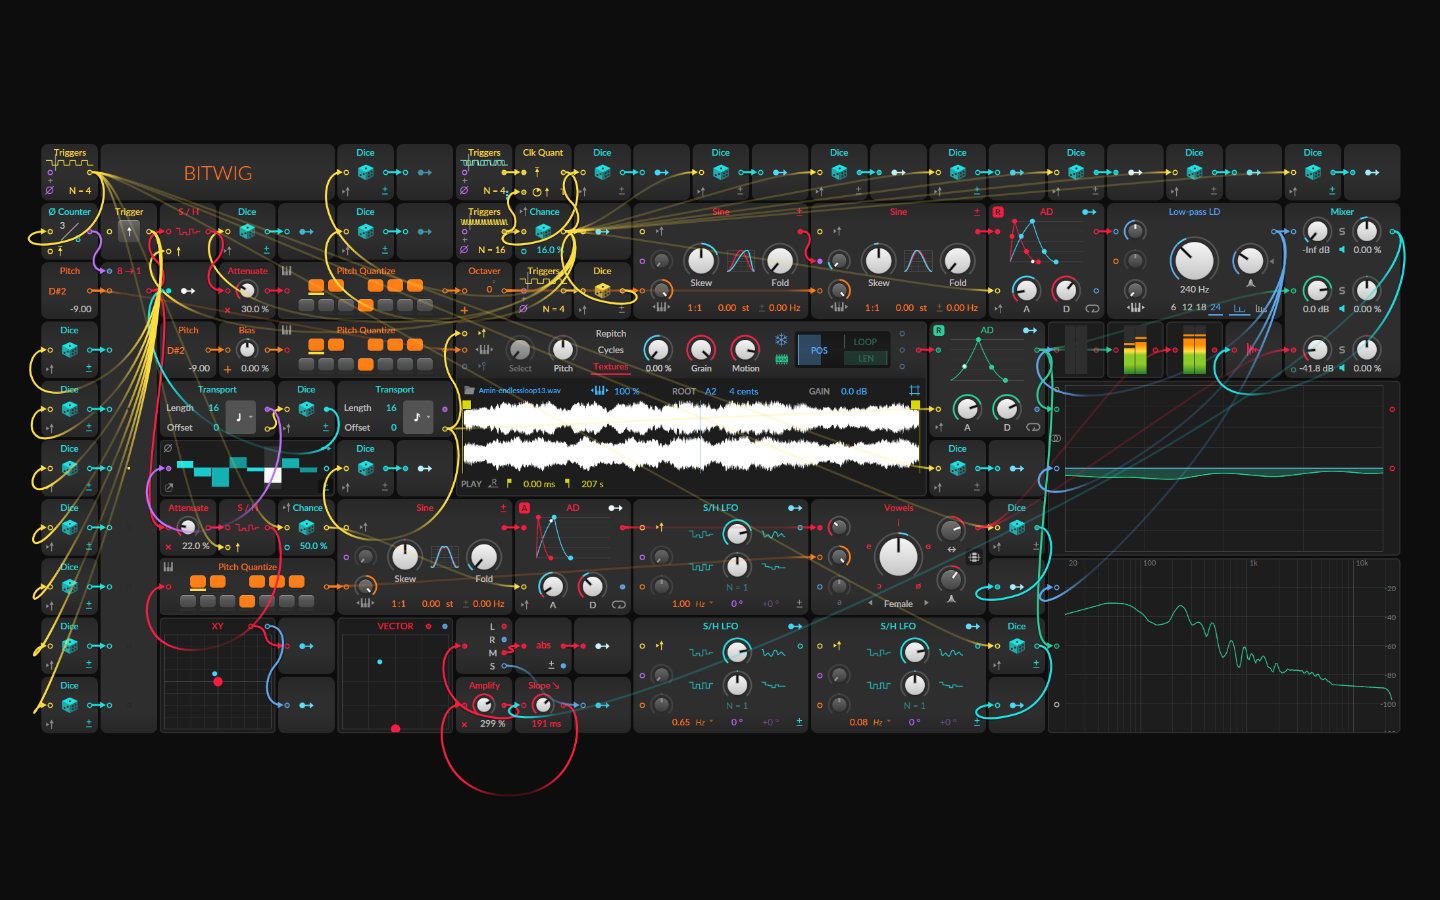
I love how bitwig solved it: gravity, color coding, stiffness, directionality (ins on the left, outs on the right).
https://polarity.me/img/bitwig-course-02-whatisthegrid-3.jpg
From EPL:
> If a Contributor Distributes the Program in any form, then: a) the Program must also be made available as Source Code, in accordance with section 3.2 ...
Except in startups that really embrace the idea of open source, no "serious" company will offer any portion of their source code under EPL license, even if that's just the modified/derived part of it. Not a chance.
For most companies, in reality, there are only two types of licenses -- copyleft and permissive, no middle ground. You either don't touch it with a 10 foot pole or do whatever you want as long as you copy and paste the attributions.
Isn't the EPL "weak copyleft", so LGPL-ish? Would companies raise similar issues about glibc and GNU libstdc++? Just curious.
I don't know enough about all those other libraries and their licenses, but I do know that as long as we don't ship those libraries, especially modified versions, it's likely ok (of course that's simplified). Some internal tooling depends on GNU tools but we are just users. For things like glibc, it's just a standard system library, so linking with it is not a problem. (I am sure legal has looked at this.)
But GPL/LGPL software is definitely the minority of software we use in any way. Basically they need to be avoided as much as possible.
Doesn't this only apply to contributors and dev users?
“Contributor” means any person or entity that Distributes the Program.1. Make graphs from Clang's AST.
2. Invent some style flourish to help follow an edge that becomes part of a bundle of many edges.
Also, by focusing on control flow graphs, the proposed method does a better job with domain-specific layout. Apparently CFG visualization and exploration is a current topic; e.g. CFGExplorer. Probably Graphviz some users would benefit if it incorporated CFG-friendly level assignment as an option.
There's already machinery in Graphviz to support polylines instead of splines, and to control edge ordering, but it is not well tested or documented. It seems tempting to incorporate an edge routing algorithm of Brandes and Kopf, based on long vertical runs with at most 2 bends per edge. This seems close to a master's degree worth of work to understand and implement.
Graphviz started almost 40 years ago, is only supported by a few (one or two?) 2nd-generation volunteers with no 3rd generation on the scene yet. Over the years we've had plenty of our own disdainful "What is all this junk" moments, about our own code and other people's (c.f. various xkcd comics), but sometimes a better perspective is asking "What is being optimized that led to some team choosing or ending up at this point in the design space". Generally, the market is addicted to features.
It is a little dismaying to see the relatively slow progress in the broad field of declarative 2d diagramming. Given the way the pendulum has swung so hard back toward language based methods and away from using interaction to do everything, you'd think there would be a bigger payoff now for doing the work. Unfortuantely tool-making has always been a tough market. The customers are generally smart, demanding, and work in cost centers so don't have generous budgets.
The full Frankenstein stack is: SpiderMonkey compiled in arm emulation mode, to a WASI 0.1 module, adapted to a WASI 0.2 component, transpiled to the web with jco, running in some random WASI shim.
We do this because the JS runtime needs inline caches to be filled out before optimization, which requires an JIT and actual execution of machine code. Otherwise you just get a graph full of Unreachable. Frankly I’m amazed it works at all.
It used to be a that the barrier of entry of creating a new tool was high - so we had to use popular pieces of software, often stretching them, or writing plugins (that had their own constraints).
Now it is often easier to write from scratch a new piece of software, for which with have full control.
We can stand on the shoulders of giants - not just "a giant".
But based on my experience with multiple project, both current frameworks and AI changed the game. I used to much more reply on existing software and cursing that they don't do what I want - as the time to create a personalized tool was simply much to afford. Now often it is quicker to create a personalized tool than fight with existing one.